Welcome to R2, an open access online genomics data science and discovery platform designed to assist the bio-medical researchers with limited to no Bioinformatics skills to perform data mining tasks in the omics field.
Our mission is to provide biomedical scientists with a comprehensive, user-friendly platform for analyzing, interpreting and visualizing genomic data, enabling them to make more informed decisions and advance their research in the field of genomics without the need for bioinformatics or coding expertise (nocode).
By leveraging cutting-edge technology and incorporating the latest scientific insights, our platform aims to streamline the genome analysis process and facilitate the discovery of new insights and breakthroughs in the field of genomics.
Through our commitment to excellence and innovation, we strive to be a leading provider of online genome analysis tools for scientists.
Tell your stories in data
Sign into your account
Don't have an account?
Forgotten password?
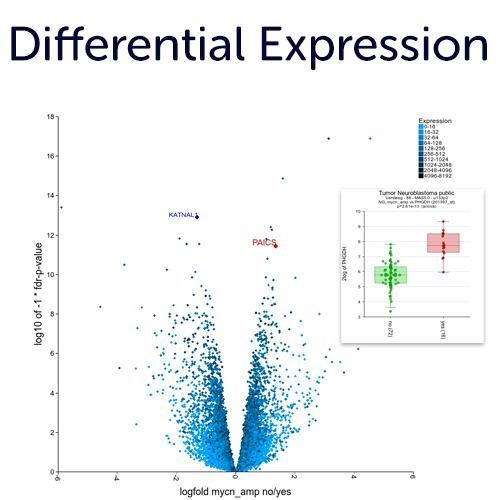
Differential Expression Analyses in an interactive fashion without scripting.
The interface and design of R2 has been created to easily follow your path by inter connecting analyses and data visualization there of. This allows you to follow an hypothesis from a bird's eye view up to the details of a statistical test result and vice versa.
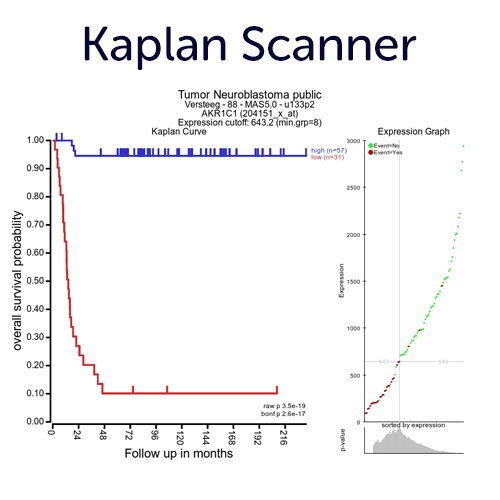
Perform Survival Analyses on Gene Expression with Optimal Cutoffs.
Use our KaplanScanner tool to find the optimal 2 group segregation (based on the expression of gene) on the logrank p-value for Kaplan Meier curves with the best survival difference. Next to the KaplanScan option, the R2platform also provides other separation options to assess segregation from gene expression, such as median, quartiles, of the average expression of a gene.
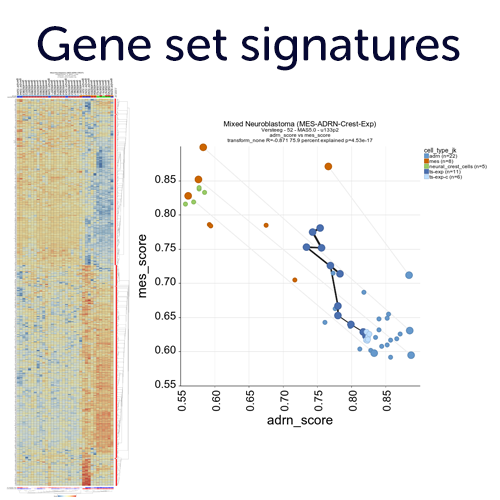
Create gene set signatures and employ those as meta genes.
Convert lists of genes (gene sets) into a single value and store those as a new meta feature in your account. These meta genes can then be used for association analyses and represent e.g. pathway activities. The R2 platform provides a large resource with public gene set databases such as MSigDB, KEGG pathways and many more. In addition, you can start creating your own gene sets from analyses performed in R2, or by cut and paste in your own account.
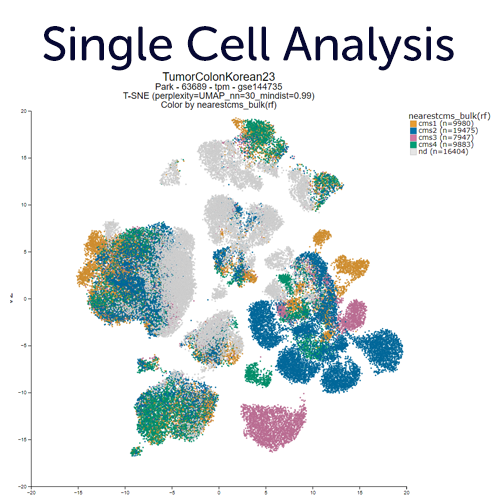
Single Cell RNA-seq Exploration.
Generate new embeddings or explore (published) dimensionality reduction views (PCA, tSNE, UMAP) of single cell experiments. Overlay those with annotations (grouping variables), meta features, gene expression data or other multi omics overlays. You can also define regions of your interest with the lasso tool, or aut-detect clusters using the DBscan algorithm. R2 typically stores multiple embeddings for a data set, from parameter sweeps in UMAP and tSNE settings. These can be helpful in assessing robustness, and finding the optimal view to tell your story.
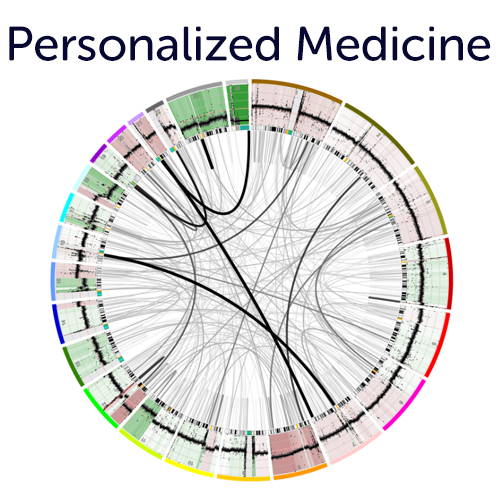
Precision Medicine Platform multi omics integration for single patient data.
Use our different entry points (e.g. onco plot, circos views, mutation view etc. ) to assess targets for potential treatment options from the R2 integrated single sample overviews. These features are also insightful for (PDX / Cell line) model systems. Simply use one of our public data scopes to see how insightful these representations can be.
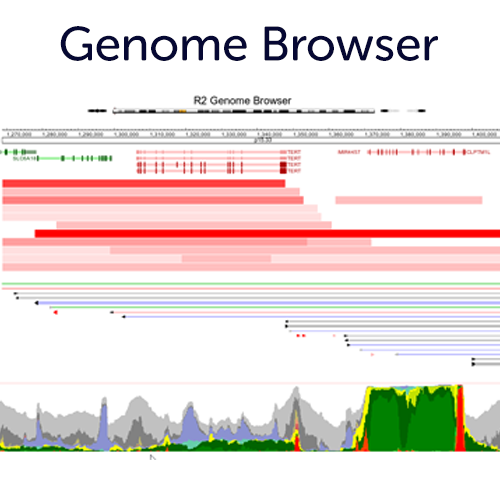
Use our Embedded Genome Browser completely integrated with the R2 Tools
Use our embedded genome browser to change perspective on your differential expression analyses, or simply use the chromosome location to integrate the many genome plugins (with adaptable settings) to gain new insights. If you register an account, you can also store these representations as presets for later re-use.
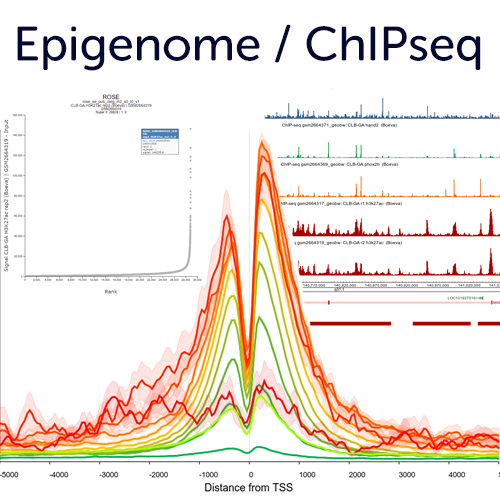
Epigenome & ChIPseq analyses to explore gene regulation and genome organisation
R2 hosts many public histone modification / transcription factor ChIPseq profiles that can be useful in understanding transcriptional changes. Use the embedded options in the ChIP section such as, TSS plots, multi region views, ROSE super enhancer options and more. In addition, it is also possible to have your private profiles added to R2
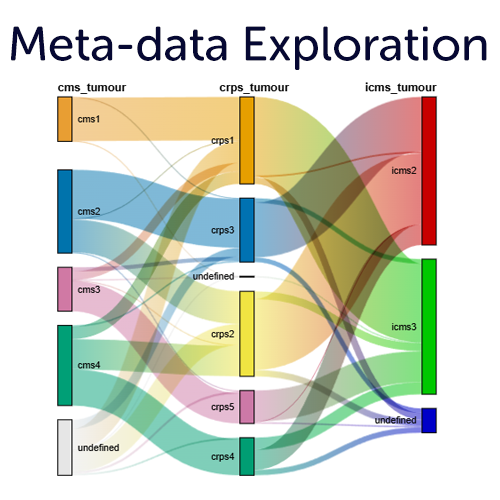
Meta-data insights on all grouping variables
The R2 platform allows you to visualize, explore and statistically analyze all of the meta data that is provided by the different resources in interactive plots. In addition, you can add your own (private) grouping variables based on your analysis results, or using our intuitive metadata creators. Visualize the annotations in comprehensive plots such as Sankey plots, multi layered circle plots, heatmaps and more.
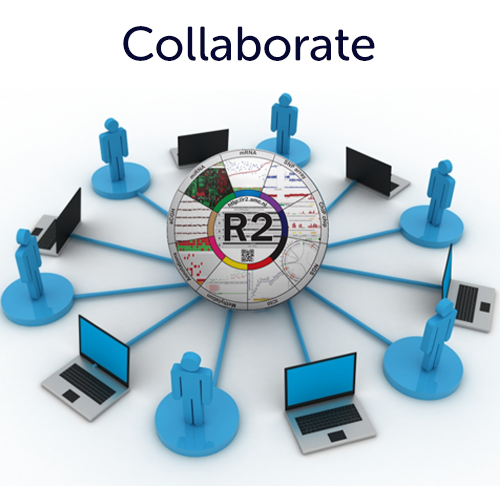
Collaborate with other users from the R2platform
Every user can start communities where meta-data, presets and more can be shared between those users you invite. Next to this, complete resources can be shared in private areas within user groups and/or consortia. R2 can also serve as your long-term resource memory by keeping all your data instantly accessible over your complete research era.
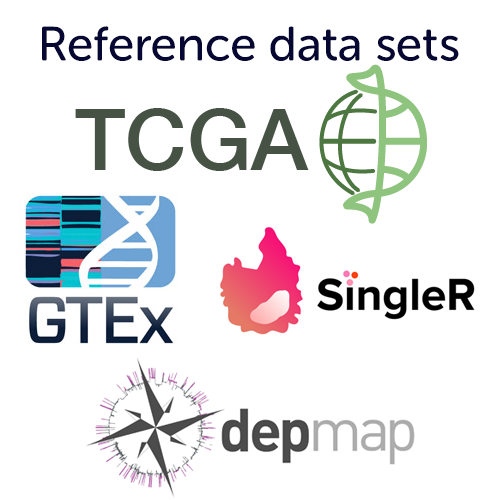
Reference cohorts such as TCGA / GTEx / DepMap
The R2 platform has hundreds of public data resources readily available for immediate exploration including: GTEx, the normal tissue reference; TCGA as one of the pan-cancer references; DepMap (ccle) as cancer cell line encyclopedia. But also reference tissue sets frequently used to type single cells in singleR are readily available in R2. Data in R2 is not only FAIR, but also immediately usable for exploration by every scientist.
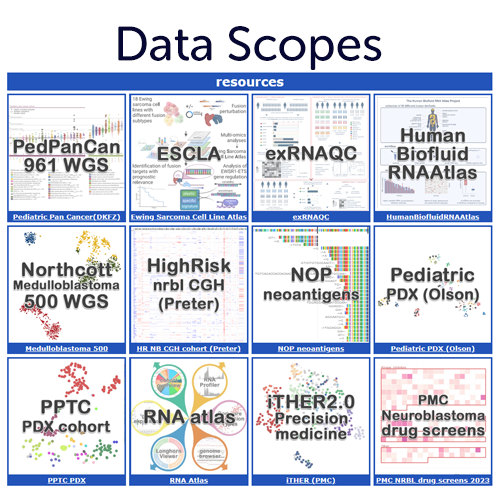
R2 Data Scopes to present your data via R2
Share your data resources from a publication or a consortium in an explorable fashion via the R2 Platform. Allow readers of your work to dig deeper or check their favourite genes / associations via quick jumps into the many functions hat R2 has to offer, with pre-filled settings. For some data scopes we have implemented dedicated functionalities into the platform. Get in touch with us if you are interested to get your (private) scope.
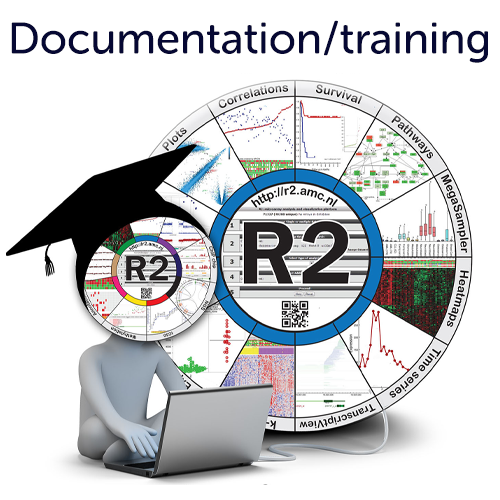
R2 Academy for training, tutorials and documentation
Make use of our unique documentation for the R2 platform, where you are guided through typical analyses via story-based step-by-step tutorials. Here you will also learn about concepts and learn to get the most out of all the features R2 has to offer. Or try the course materials we use to teach students how to use the R2 platform. You can also watch demonstration videos on our Youtube channel.
R2 citations in NCBI PubMed
The R2 plaform has been cited as a webcite in 3237 PubMed listed publications, a listing of which can be accessed from within the platform. These citations also include high impact journals such as Nature and Cell. The author network feature in R2 allows you to see how authors are connected in a playful way.
The R2 platform has completely been built in the academic medical center (AMC) in Amsterdam, the Netherlands by the team of Dr. Koster (Formerly in the Department of Oncogenomics, since 2021 within the Center for Experimental and Molecular Medicine (CEMM)).